|
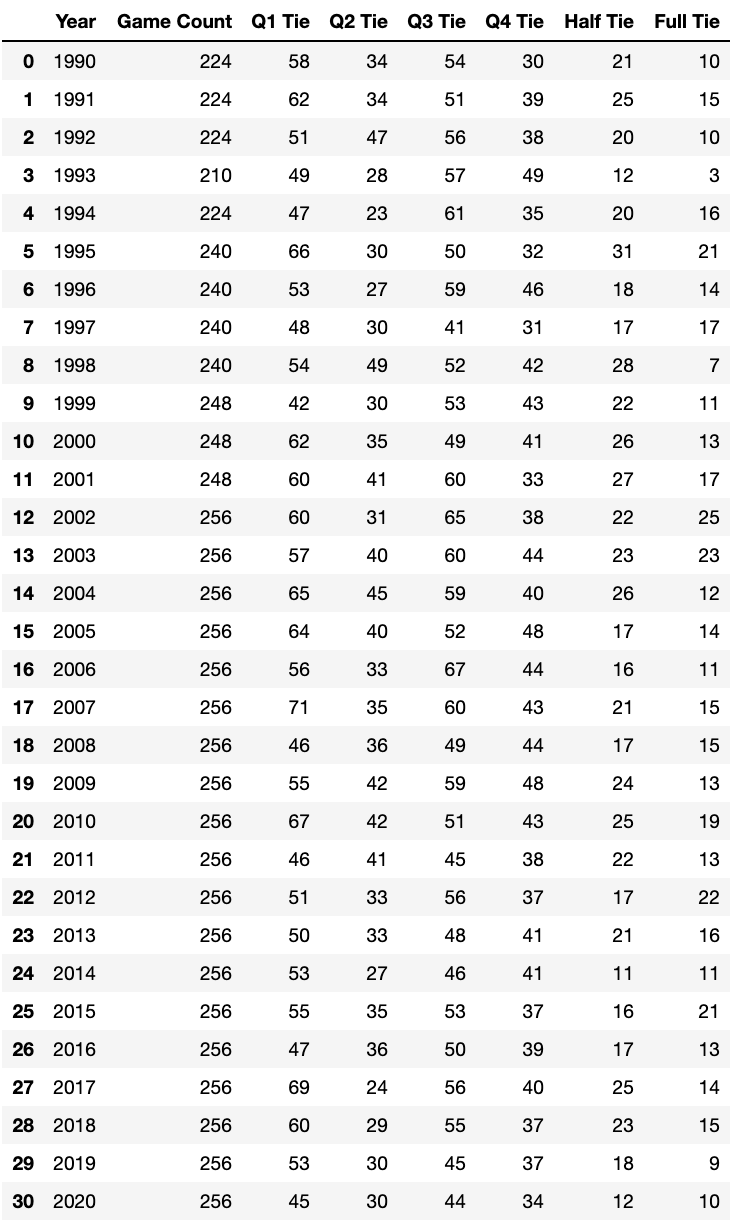
Hey guys! I hope you all enjoyed the weekend of football and are looking forward to a good matchup for the Superbowl. As a college student, I enjoy the ride of sports betting, and I especially enjoy prop bets. One prop bet I like to look at is the quarter ties. These generally have large payouts, and one would tend to believe that they can happen often -- how often do you see a 3-3 quarter, or even a 7-7 one? Turns out, it was a lot less than I expected. With a good amount of bets, such as spreads, Vegas tends to play it decently close to fair odds, but these are out of the water unfair for how often they actually happen.
This mini project was a good way for me to practice my scraping and cleaning with Pandas. Here is the DataFrame that resulted from my code. If you want to see a visualization of the results, here is a Tableau link. Game Count = Games that were played that season Q1 Tie = Ties in Quarter 1 Q2 Tie = Ties in Quarter 2 Q3 Tie = Ties in Quarter 3 Q4 Tie = Ties in Quarter 4 Half Tie = Ties after first half Full Tie = Ties after regulation
0 Comments
Leave a Reply. |
If you'd like access to the model, just email me, I'd be happy to share :)
|

