|
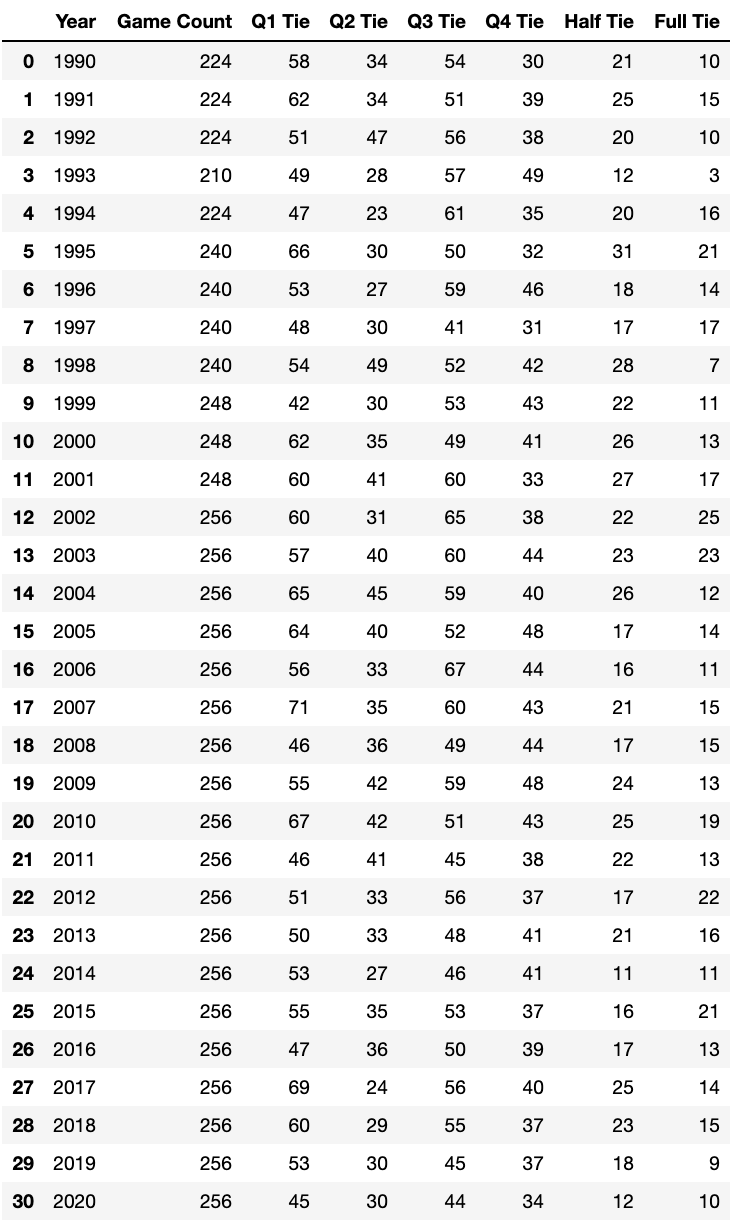
Hey guys! I hope you all enjoyed the weekend of football and are looking forward to a good matchup for the Superbowl. As a college student, I enjoy the ride of sports betting, and I especially enjoy prop bets. One prop bet I like to look at is the quarter ties. These generally have large payouts, and one would tend to believe that they can happen often -- how often do you see a 3-3 quarter, or even a 7-7 one? Turns out, it was a lot less than I expected. With a good amount of bets, such as spreads, Vegas tends to play it decently close to fair odds, but these are out of the water unfair for how often they actually happen.
This mini project was a good way for me to practice my scraping and cleaning with Pandas. Here is the DataFrame that resulted from my code. If you want to see a visualization of the results, here is a Tableau link. Game Count = Games that were played that season Q1 Tie = Ties in Quarter 1 Q2 Tie = Ties in Quarter 2 Q3 Tie = Ties in Quarter 3 Q4 Tie = Ties in Quarter 4 Half Tie = Ties after first half Full Tie = Ties after regulation
0 Comments
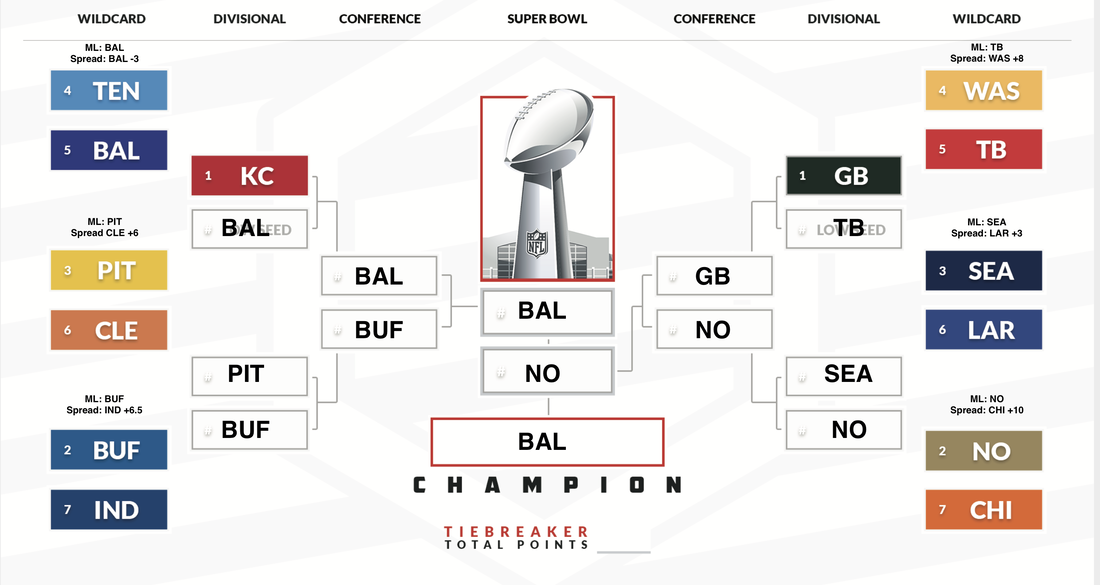
 I am proud of what the model predicted for the spreads this past week. It got 4/5 of the spreads right and then the sixth game (TB/WAS) pushed at +8. 80% of the spreads for the playoffs is pretty good, and would have turned a nice profit if I was back up where I could wager on it. I updated the necessary ELOs for the next round of the playoffs so here are my picks. The spreads are as of 1/12/2021 on Fanduel: GB/LAR: ML: GB Spread: GB BUF/BAL: ML: BUF Spread: BAL KC/CLE: ML: KC Spread: CLE NO/TB: ML: TB Spread: TB Some of these picks may be weird, but I think it is because I used the raw numbers for PF/PA rather than weighting them based on each game. Next years' model will have them be weighted per team per game, which will make the results a lot more accurate and likely change around some outcomes. For example, the Ravens have rounded 31 PF and 18 PA, but this doesn't take into account who they have actually played. I just ran the model on all of the playoff games up through the Superbowl, and the output I got was....interesting at best. I think the problem with this model is that the main factors it takes into accounts are the sets of PF/PA's and not an entire lot more than that other than ELO's and standard deviations. It pulls from ProFootballReference's websites to find the PF/PA. and to be honest, I think it might be flawed given that KC scored 14 points last week by not playing starters. I don't put any of my own bias into this output, but here it is.
Like I said, there is no way this happens, and I really don't think Baltimore is capable of winning the championship at this point. The model did have a great year but this is, as they call it, a scorching take. This week was a solid week for the model, with a win accuracy of 81.25% and a spread accuracy of 62.5%. The model did not know how to interpret the Chiefs deciding to bench their important offensive starters, so the model took a hit there. I think that it is ready to use in the playoffs. Later on this week, I will provide hypotheticals that I think will happen in the playoffs based on the model output. Also, sorry for not posting last week. I was very busy applying to jobs and grad schools.
Next year, the model will ride all 17 weeks instead of just 8 as to get more accurate predictions and results. I also was a little too busy to transfer the model to Python and adapt it to look at NBA games, so that will be a future project. Statistics for the model for the 8 weeks I was able to use it:
Obviously, these numbers leave lots of room for improvement, but this was a great introductory personal project to learn how to model. As always, you can check out the visualization for the model results here. Thank you to whoever has read through these posts, and I'll provide the predictions for the NFL playoffs soon! Cheers Brendan Week 14 was a pretty eventful week, my personal favorite moment being the Ravens and Browns having a fourth quarter touchdown frenzy. The model performed decently, but there was one obstacle that absolutely killed my win percentage: the relevancy of the NFC East! For such a losing division, they have been killing it these past two weeks and hopefully my model will reflect that more.
The adaptive spread is still becoming more accurate, seeing 62.5% accuracy (10 of 18). This may not sound like much, but let's do a quick probability trial right here. Spread is where they think 50% of betters will place on both sides, and is pretty indicative on how Vegas thinks the game will actually be played out. For math purposes, and for me not wanting to look at each percentage individually, let's assume the spread represents 50% of bettors on each side. Treating this as a binomial distribution (win or don't win), we can actually calculate the percentile my picks were for this week. P(x>=10) would represent the percentile, and this would be the sum from x=0 to 10 of (16 choose x) * 0.5^16, which is 0.895, or better than or equal to 89.5% of random picks. Check the math here if you want to see it. I'd say that's something to be proud of, but we have to keep working. Something about the model that bothered me was that it didn't account for the strength of a team that was won against. The model only pulls PF/PA's for each team overall throughout the season and doesn't necessarily account for who they played. I want to reference the Steelers, possibly one of the worst 11-0 teams I have ever seen, and how they have lost two straight. My model LOVED the Steelers, but there has to be a way to get a better assessment of skill than straight ELO. This is when I came up with an idea: why not combine the thought of a team's winning record and the ELOs of the teams they have played. I want to give you an example right here. Let's look at a team right here: Team 1 beats Team 2 (ELO 1200) Team 1 beats Team 3 (ELO 1300) Team 1 loses to Team 4 (ELO 1500). Team 1 elowin% = (1200+1300)/(1200+1300+1500) = 2500/4000 = 0.625. A straight up win percentage would have been 0.667 for this team, but they didn't play anyone of significance, really. My only hesitation for this is that it heavily penalizes for losing to a good team. I need to work a way around that before I can implement it into the model. I am still using the same version of the model as I did three weeks ago, as I have been bogged down with studying for the GRE and applying for jobs. Once I can secure something, I will invest much much more time into this. For now, let's keep winning. You can find an updated Tableau Dashboard where the old one was right here as usual. Have a great week, guys! Hey guys!
After a tough Week 11 and some pretty significant model changes, I was looking forwards to a successful Week 12. Thanksgiving proved to be a great test of the model, as the model nailed both of the winners and both of the spreads.
This week saw a 18.75% increase in win probability success, a 8.04% increase for the spread success, and a 20.54% increase in adaptive spread success. The original adaptive spread was an exaggerated version of the spread, but this week's was a more conservative spread, and it proved to be a lot more successful. Of the teams that won, the adaptive spread was correct 8 out of 12 times (about 75%) which is nothing to scoff at but nothing to be proud of either. Based on the spread being the 50/50 tipping point of the predicted score, the general probability of getting this is 12.08%. I want to see how the adaptive spread continues to develop as the weeks progress. I really liked the way it performed this week, but I hope that this next adaption it takes doesn't tank its accuracy For this week, I am not going to adjust the model because I want to see how the big changes I made last week work out. For those of you who are keeping up with this, thank you! I am really excited to be learning how to make a model. 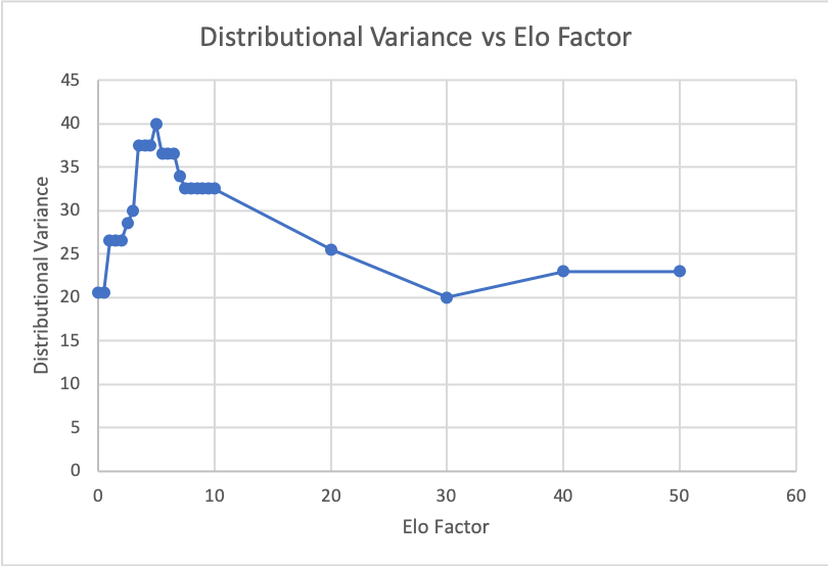 I am revealing that a pivotal component of my model is the ELO ratings assigned by FiveThirtyEight to each team every week. One can obtain .json's with their data from the website and take the ELO data from there. I have partially been using ELO to weight each game, but I have only been using the most recent ELO. For example, if a team had a great week but then a streak of horrible weeks, the great week would never even be accounted for. One of the changes I brought to the model was to time-weight the ELO ratings based on week played.
To do this, I created a factor that I would use to adjust the weighting of the week, so that I would account for all of the preceding weeks, but they wouldn't all be weighted evenly. To solve for the ideal ELO factor to use, I floored the different teams' adjusted ELO values based on the hundreds value and aligned it with a sorted range of the teams' winning percentages. This, I believed, would grant me the highest accuracy with regards to finding a fair ELO value. They were matched as such: x<=1300 0.000-0.200 x=1400 0.200-0.400 x=1500. 0.400-0.600 x=1600. 0.600-0.800 x>=1700. 0.800-1.000 The goal was to minimize the variance of the difference of the count between each subsection. Excel's Solver couldn't solve for this, so I decided to do so myself, and I found that there is an incredible amount of overall variability in the 0-10 range, but an increased ELO factor mellowed the distribution out a lot. The ideal value ended up being 30, as this matched the columns up the most accurately. Also, I have changed the adaptive spread measures. I had been solving for it wrong before and only accounting for a difference in the positive spread, which is dumb on my part. I want to minimize both sides of it, not just the positive side. I accounted for the absolute value of the spreads and used solver to minimize that and got more of a mixed distribution of results. I have plugged these new values into the model, and I am ready to see how they work this upcoming week! Maybe it will have a better understanding of how to predict the Winners of this week's games and their corresponding spreads. Wish me luck!  I will admit...Week 11 did not go as planned. There were a lot of upsets throughout the weekend, and Vegas did incredibly well ATS (against the spread) this weekend. My percentages weren't great, I will admit. One could argue that they could have randomly picked the wins and covers and done better overall. It happens to the best of us, and the only thing we can do is get up from the loss and figure out what went wrong. So first of all, I would like to address the concept of the Adaptive Spread. Last week I mentioned that we had three different spreads and that I would use Excel's Solver to adjust the weights to minimize the difference between the actual spreads and the observed spreads. Last week, it wanted me to focus 100% of my efforts on the consistently larger spread, which could be due to the outcome of last week's games. I decided to try it for this week, and due to the many upsets that occurred, it did not do any better than the cover accuracy. I plan to plug more numbers into the adaptive spread formula to get a more comprehensive ratio balance. I also want to make some adjustments per the win accuracy. I want to take a weighted time-focused approach more than an overall season approach, as many teams play at a different level at this point in the season than they did at the beginning. Thus, I will try weighting the ELO's that I use differently. I hope this next week will be better, but we live and we learn! 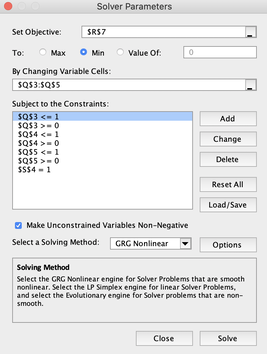 Week 11 starting means that I have another chance to adapt the model and make it potentially more accurate. Today, the Seahawks and the Cardinals are playing. From last week, my win accuracy was around 86%, but my cover accuracy was only 50%. My wins were well calculated, and I am very happy about that, but you could flip a coin for each of the spreads and do just as well as I did, so that definitely needs fixing If you looked in my last posts, you can tell that there is a difference between my predicted score and my spreads. That is because the predicted score is derived formulaically from the PF, PA, and adjusted ELO of each team, whereas the spread calculation is a lot more involved. The spread calculation is based off of the weighted averages of three different spread calculations. For the first week, I took an educated guess on how much to weight each of the three spreads, but this week I am trying something different. This week, I decided to add an adaptive spread component to the model. This will adjust the weights week after week based on how accurate the last week's projected spreads guessed the observed spreads. I will cumulatively look at the effect of these weights, and hopefully over time be able to have a higher spread covering percentage. Week 10 proved to be a decently reliable model.
The model could not predict the upset of the Giants over the Eagles. The model gave the Eagles a 63.2% chance of winning, the game. This was a clear upset, and not many people expected this to occur. The model uses common statistics, and doesn't necessarily account for a team's ability to upset unless they are close with regards to the winning percentage. A potential change for next week's model could account for the general team momentum. Next week, I would like to account for a team's ability to play against the spread they were dealt. To do this, I need to obtain each team's spreads from a consistent book and do a few calculations. I feel like ATS % could be useful with regards to my spread % but not to my winning percentage. I would also like to account for win streak for each team, as a team on a hot streak is undoubtedly better than a team coming off of a healthy mixtures of losses and wins. This model would have improved to a little over 60% cover accuracy if the Cardinals did not kneel for the extra point after their game-winning touchdown. As for the O/U accuracy, I need to rework a new algorithm to make this more consistent. Before, I used the sum of the predicted scores as the over/under, but that resulted in a worse outcome than just randomly predicting the O/U. so I need to brainstorm idea on that Hey guys! All my life, I have been passionate about math. I love numbers and I really enjoy the way they can be used to explain the world around us.
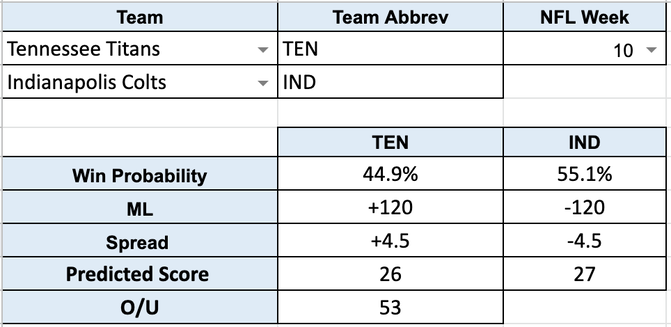
I am also a very passionate sports fan. I played just about every sport imaginable growing up, and I still try to remain as active as possible to this day. Over the past few days, I have been working on a mathematical model that predicts the outcomes of NFL games. I learned how to use the importXML function within sheets to pull some important data from the web, and I use different variables (gonna keep this secret) to predict the scores of NFL games. The inputs will be Team 1, Team 2, and which week the NFL is on (yes, this matters). The model will output a win probability, predicted score. The reason that the spread doesn't match the predicted score is that the predicted score is a calculated average, whereas the spread a more in-depth calculation, and is a simulation-based weighted average of a few different ways I calculated spreads. After this week, I will see where I stand and adapt the model from there. This is just the start. |
If you'd like access to the model, just email me, I'd be happy to share :)
|
